Our personnel profile is reflected in the table below:
(Equity Report as at March 2021)
F= Female
M= Male
A=African
C=Coloured
W=White
GENDER
RACE
Occupational Level
M
F
Total
A
C
M
Total
Top Management
2
1
3
0
2
1
3
Senior Management
9
2
11
7
1
3
11
Middle Management
8
3
11
7
2
2
11
Junior Management
8
1
9
9
0
0
8
Administrators
6
3
9
8
1
0
9
Plant & Machine Operators
26
0
26
26
0
0
26
Skilled Workers
27
2
29
28
1
0
29
Semi-Skilled Workers
2
1
3
3
0
0
3
Elementary Occupations/ Unskilled Workers
69
44
113
107
1
5
113
Learners/ Internships
4
2
6
4
2
0
6
GRAND TOTAL
161
59
220
199
10
11
219
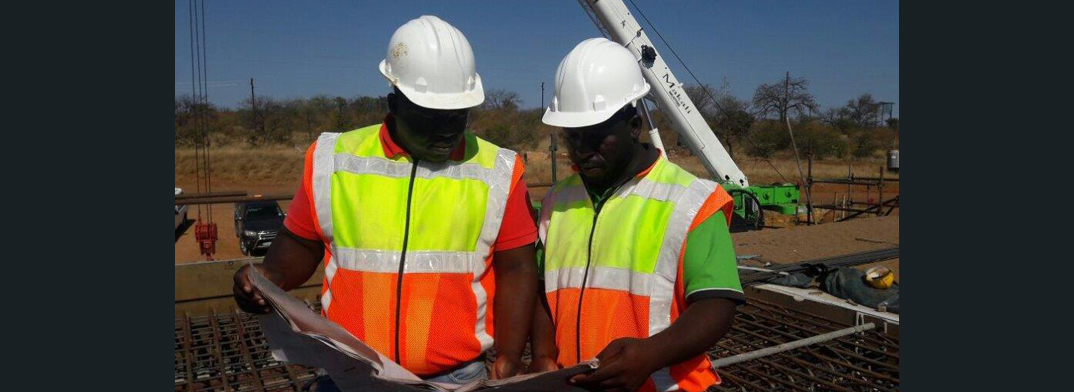
Over the years the company has fulfilled the role of both sub-contractor and main contractor on various roads, bridges and water reticulation plant construction projects, varying in size, monetary, value and levels of complexity.